| ANALYZE GAMES
|
|
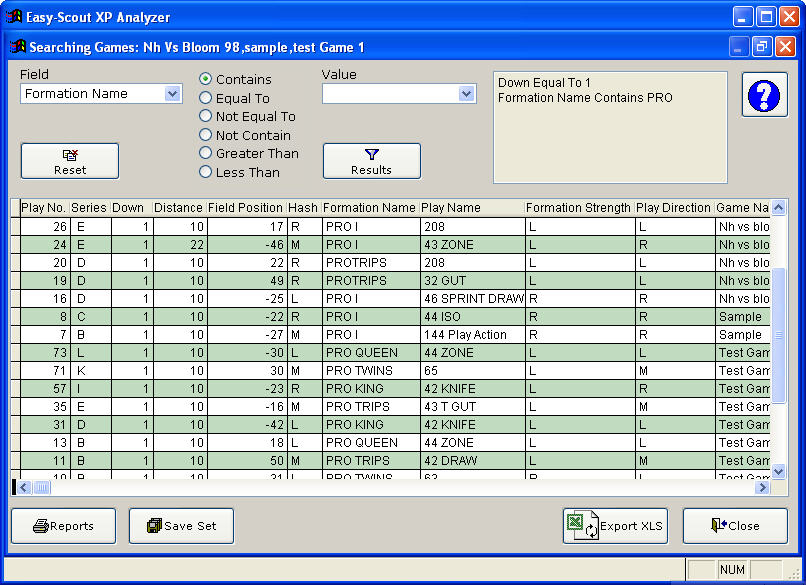
USING THE ANALYSIS GRID Easy-Scout XP Analyzer has an enhanced version of the View Games "Grid" that is present in Easy-Scout XP. Designed to work with more than one game at a time, the analysis Grid in Analyzer includes a number of powerful yet easy-to-use features and is capable of displaying plays from more than one game at a time. The form is structured so that the "controls" at the top of the Grid adjust the Grid's "contents" (plays) and how they are displayed and those at the bottom "process" those contents. To add a Filter "condition":
There are a number of things worth noting about the Analysis grid (shown above):
The Analysis grid is an extremely powerful and flexible tool. With just a few clicks of the mouse it is possible to perform extensive "on-screen" analysis on single or multiple games. Then, using one of the built in templates, this data that results from this analysis can be formatted and presented in a “paper-report” format or even exported to Microsoft Excel. The result is a tool for the analytical coach that makes it possible to quickly isolate and review any play in any game as well as perform further analysis. REPORTS Clicking Reports will open the Filtered Reports Manager . This is explained in detail on its own help screen. SAVE SET Clicking Save Set will save the plays that are "in the grid" at that time to a file. When saving a result set, you will be asked to provide a Result Set Name and Result Set Description. These labels along with the names of the games that were used to create the result set will be displayed on the Select Games screen to make it easy to identify the contents (plays) that are contained in each "set". EASY-EXPORT The Easy-Export capability in Analyzer has multi-game capability - meaning it can create an Excel file with data from more than one game. Plus, Analyzer will remember the way you arrange the column headings and apply that to the order in which it creates columns in Microsoft Excel. Coaches who are accustomed to using Excel for analysis or preparing charts and graphs, will find that Easy-Scout XP Analyzer makes that much easier to do. Taken alone, the Multi-Game analysis and Easy-Scout Export are powerful new capabilities. These capabilities are significantly enhanced when combined with the printing process.
|
